
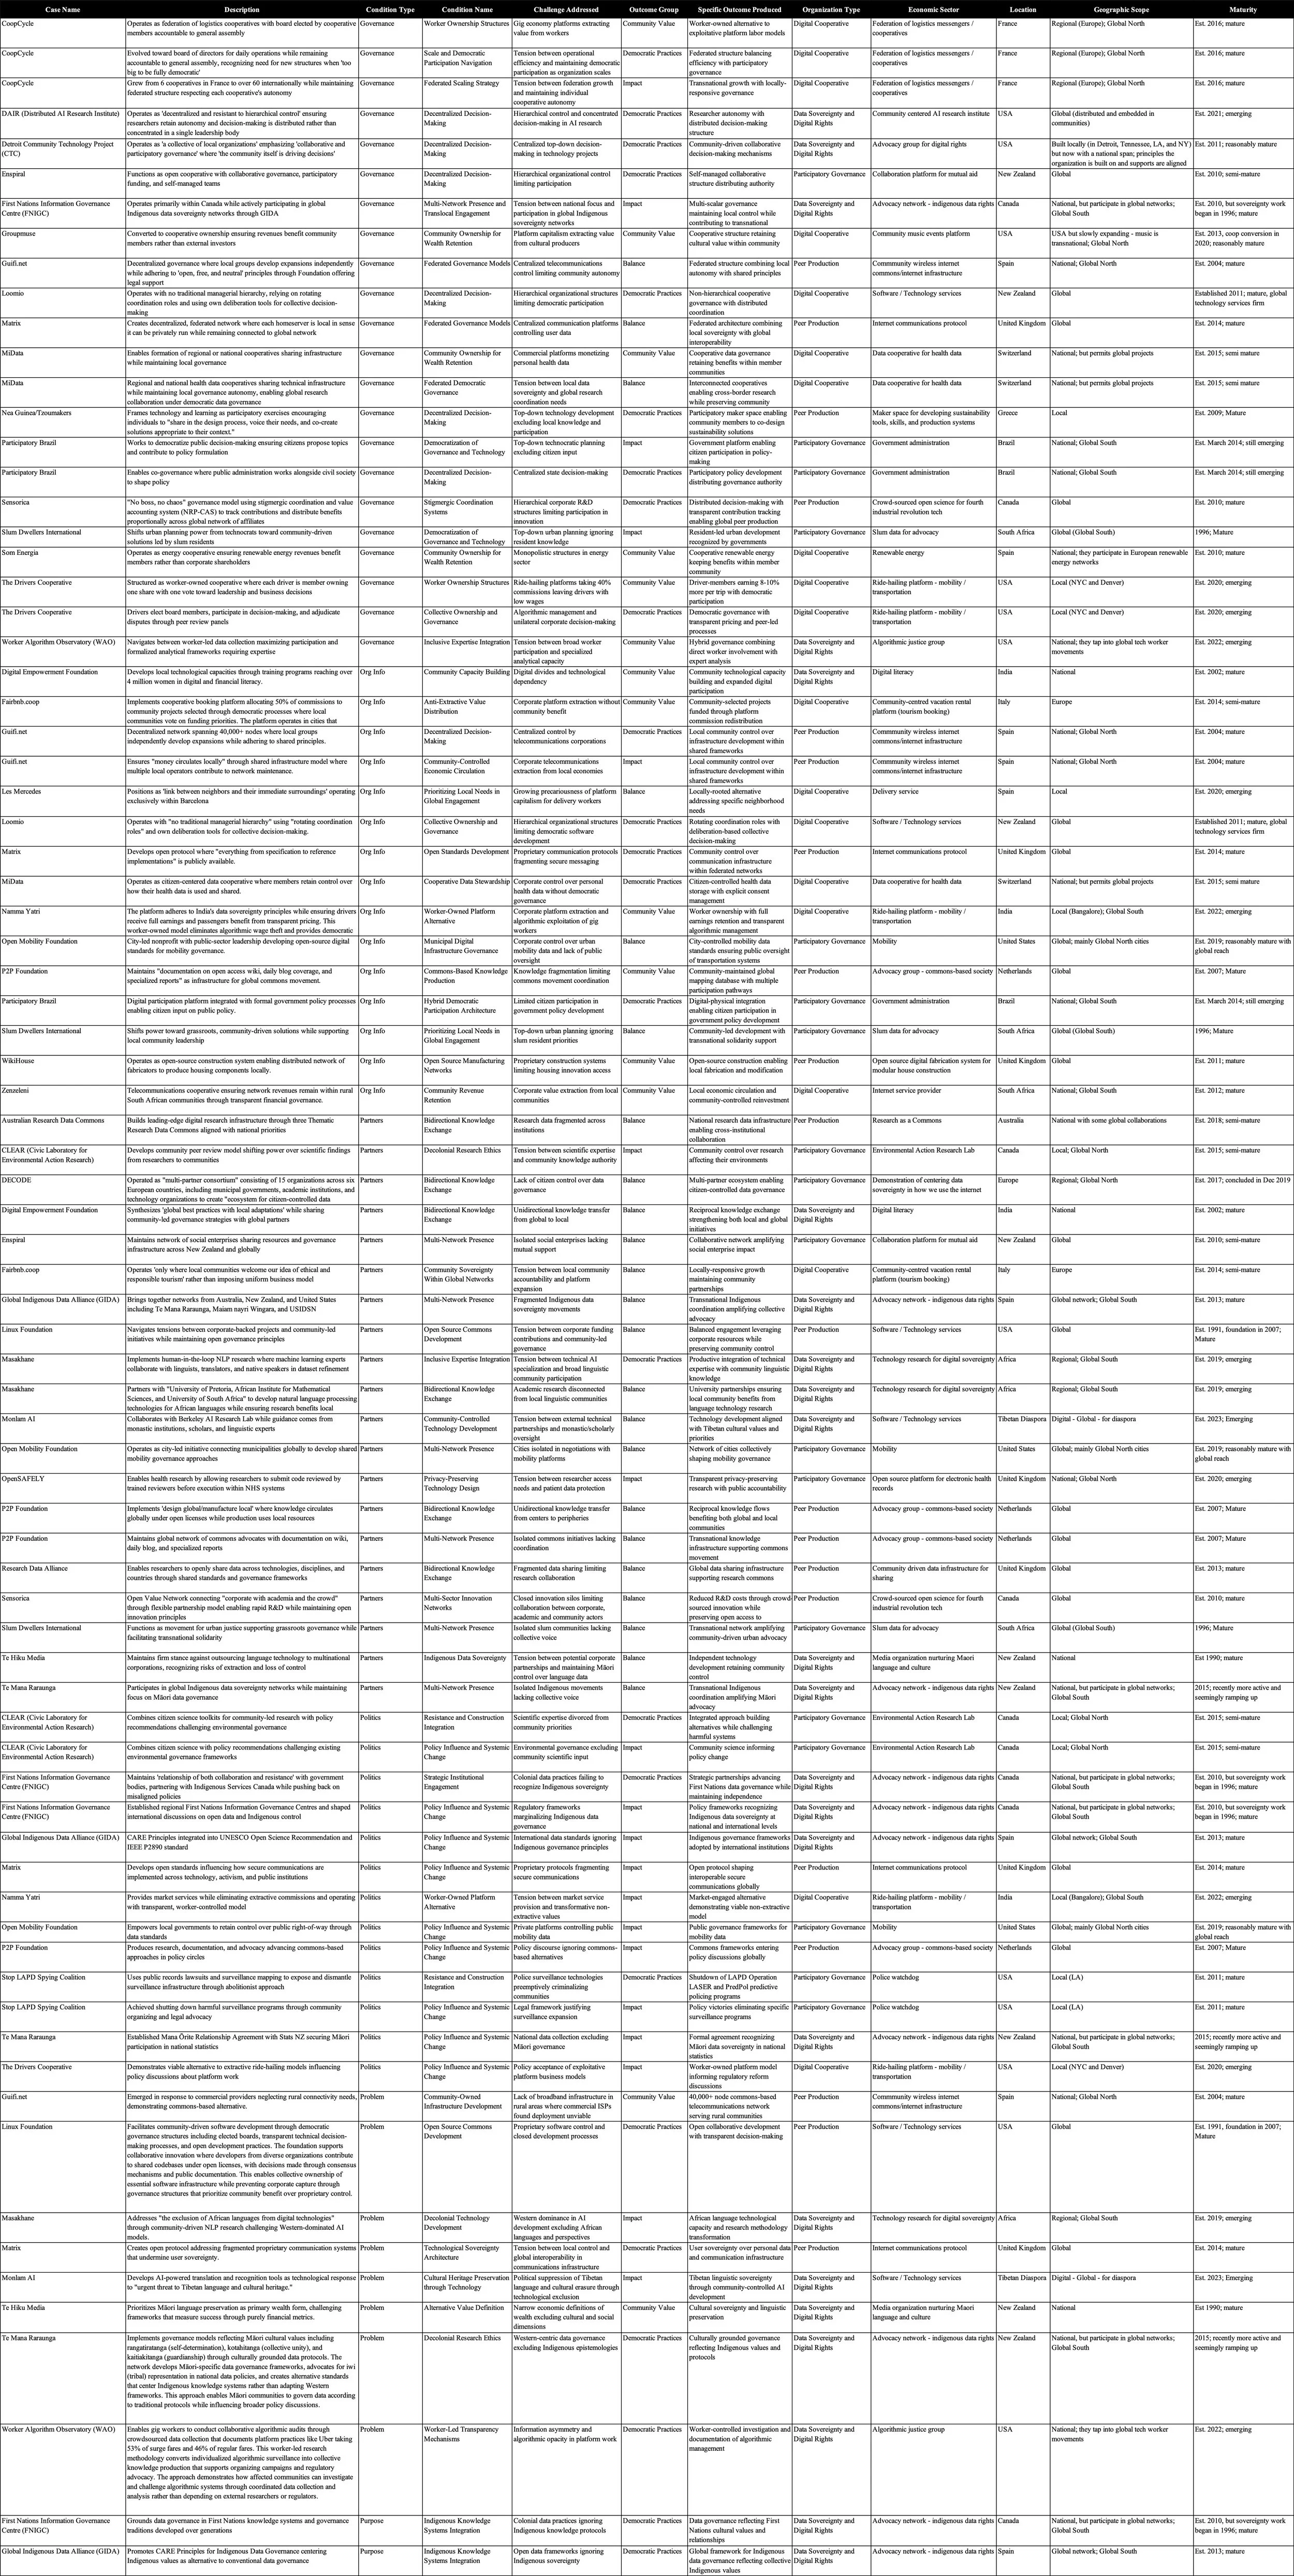
The image below is a section of the full, ‘Master’ Conditions and Outcomes Table. The link to the excel file is here.
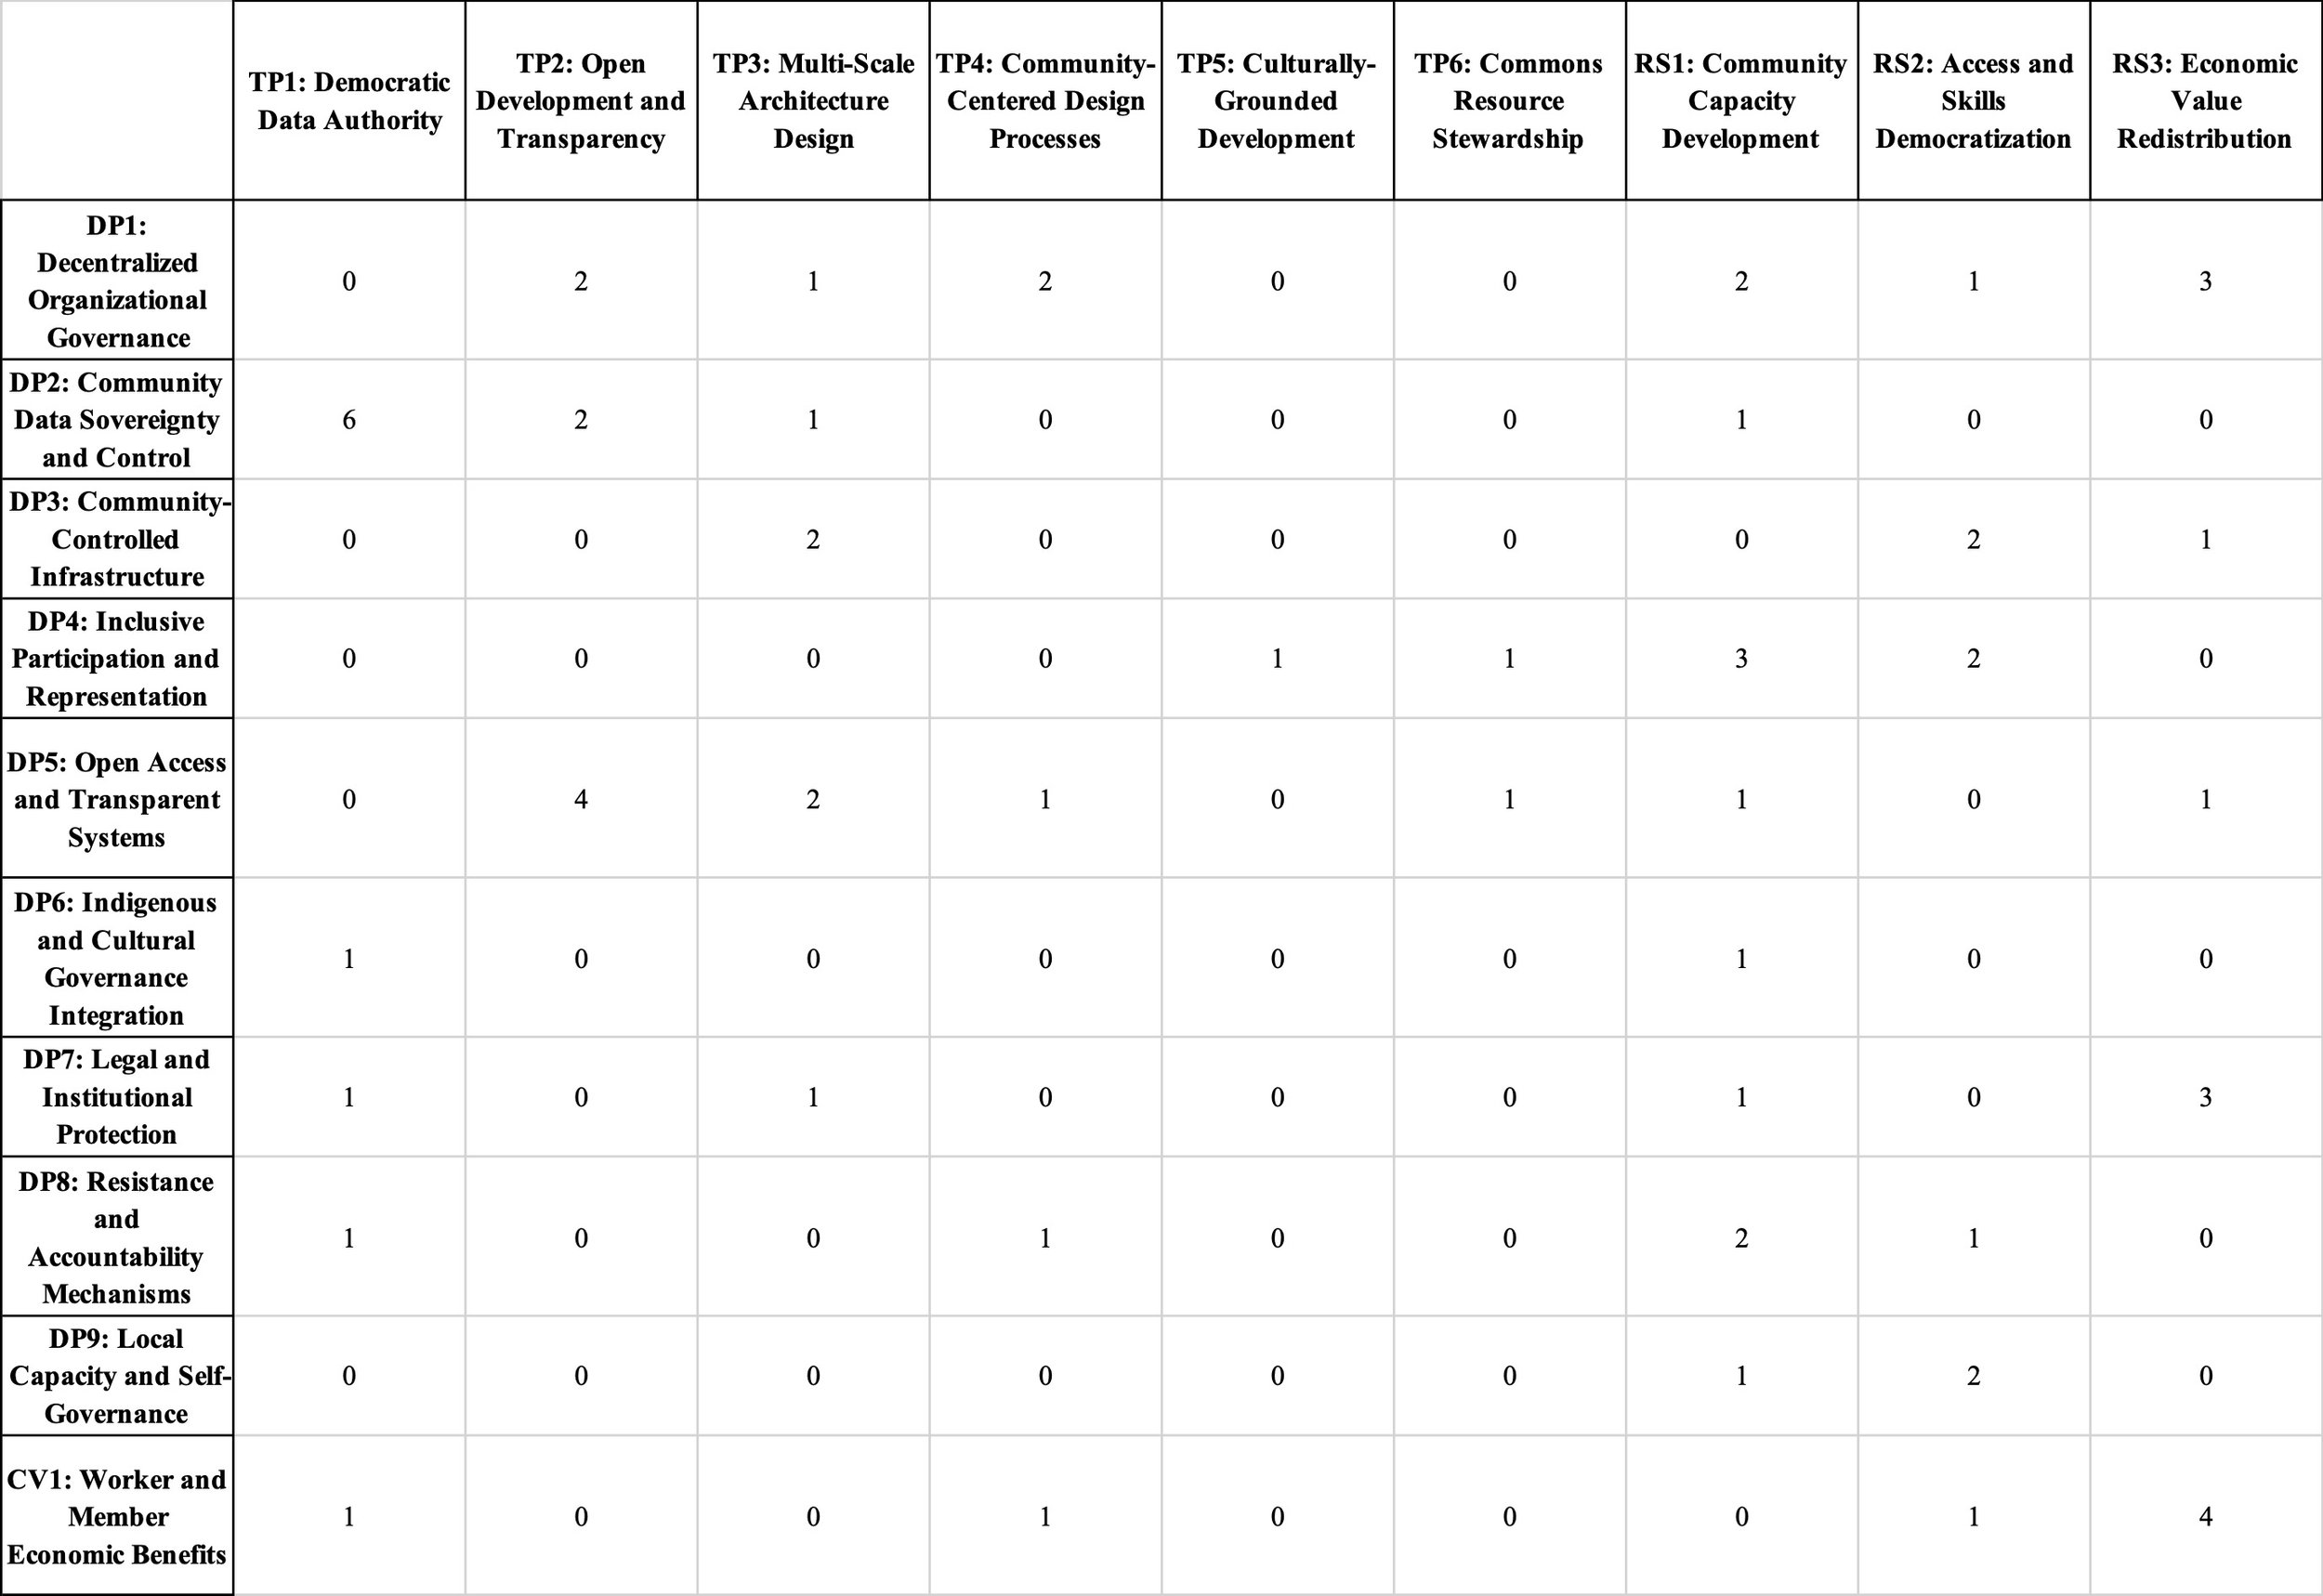
The image below is a section of the quantitative Outcomes x Conditions matrix. The link to the Excel file is here.
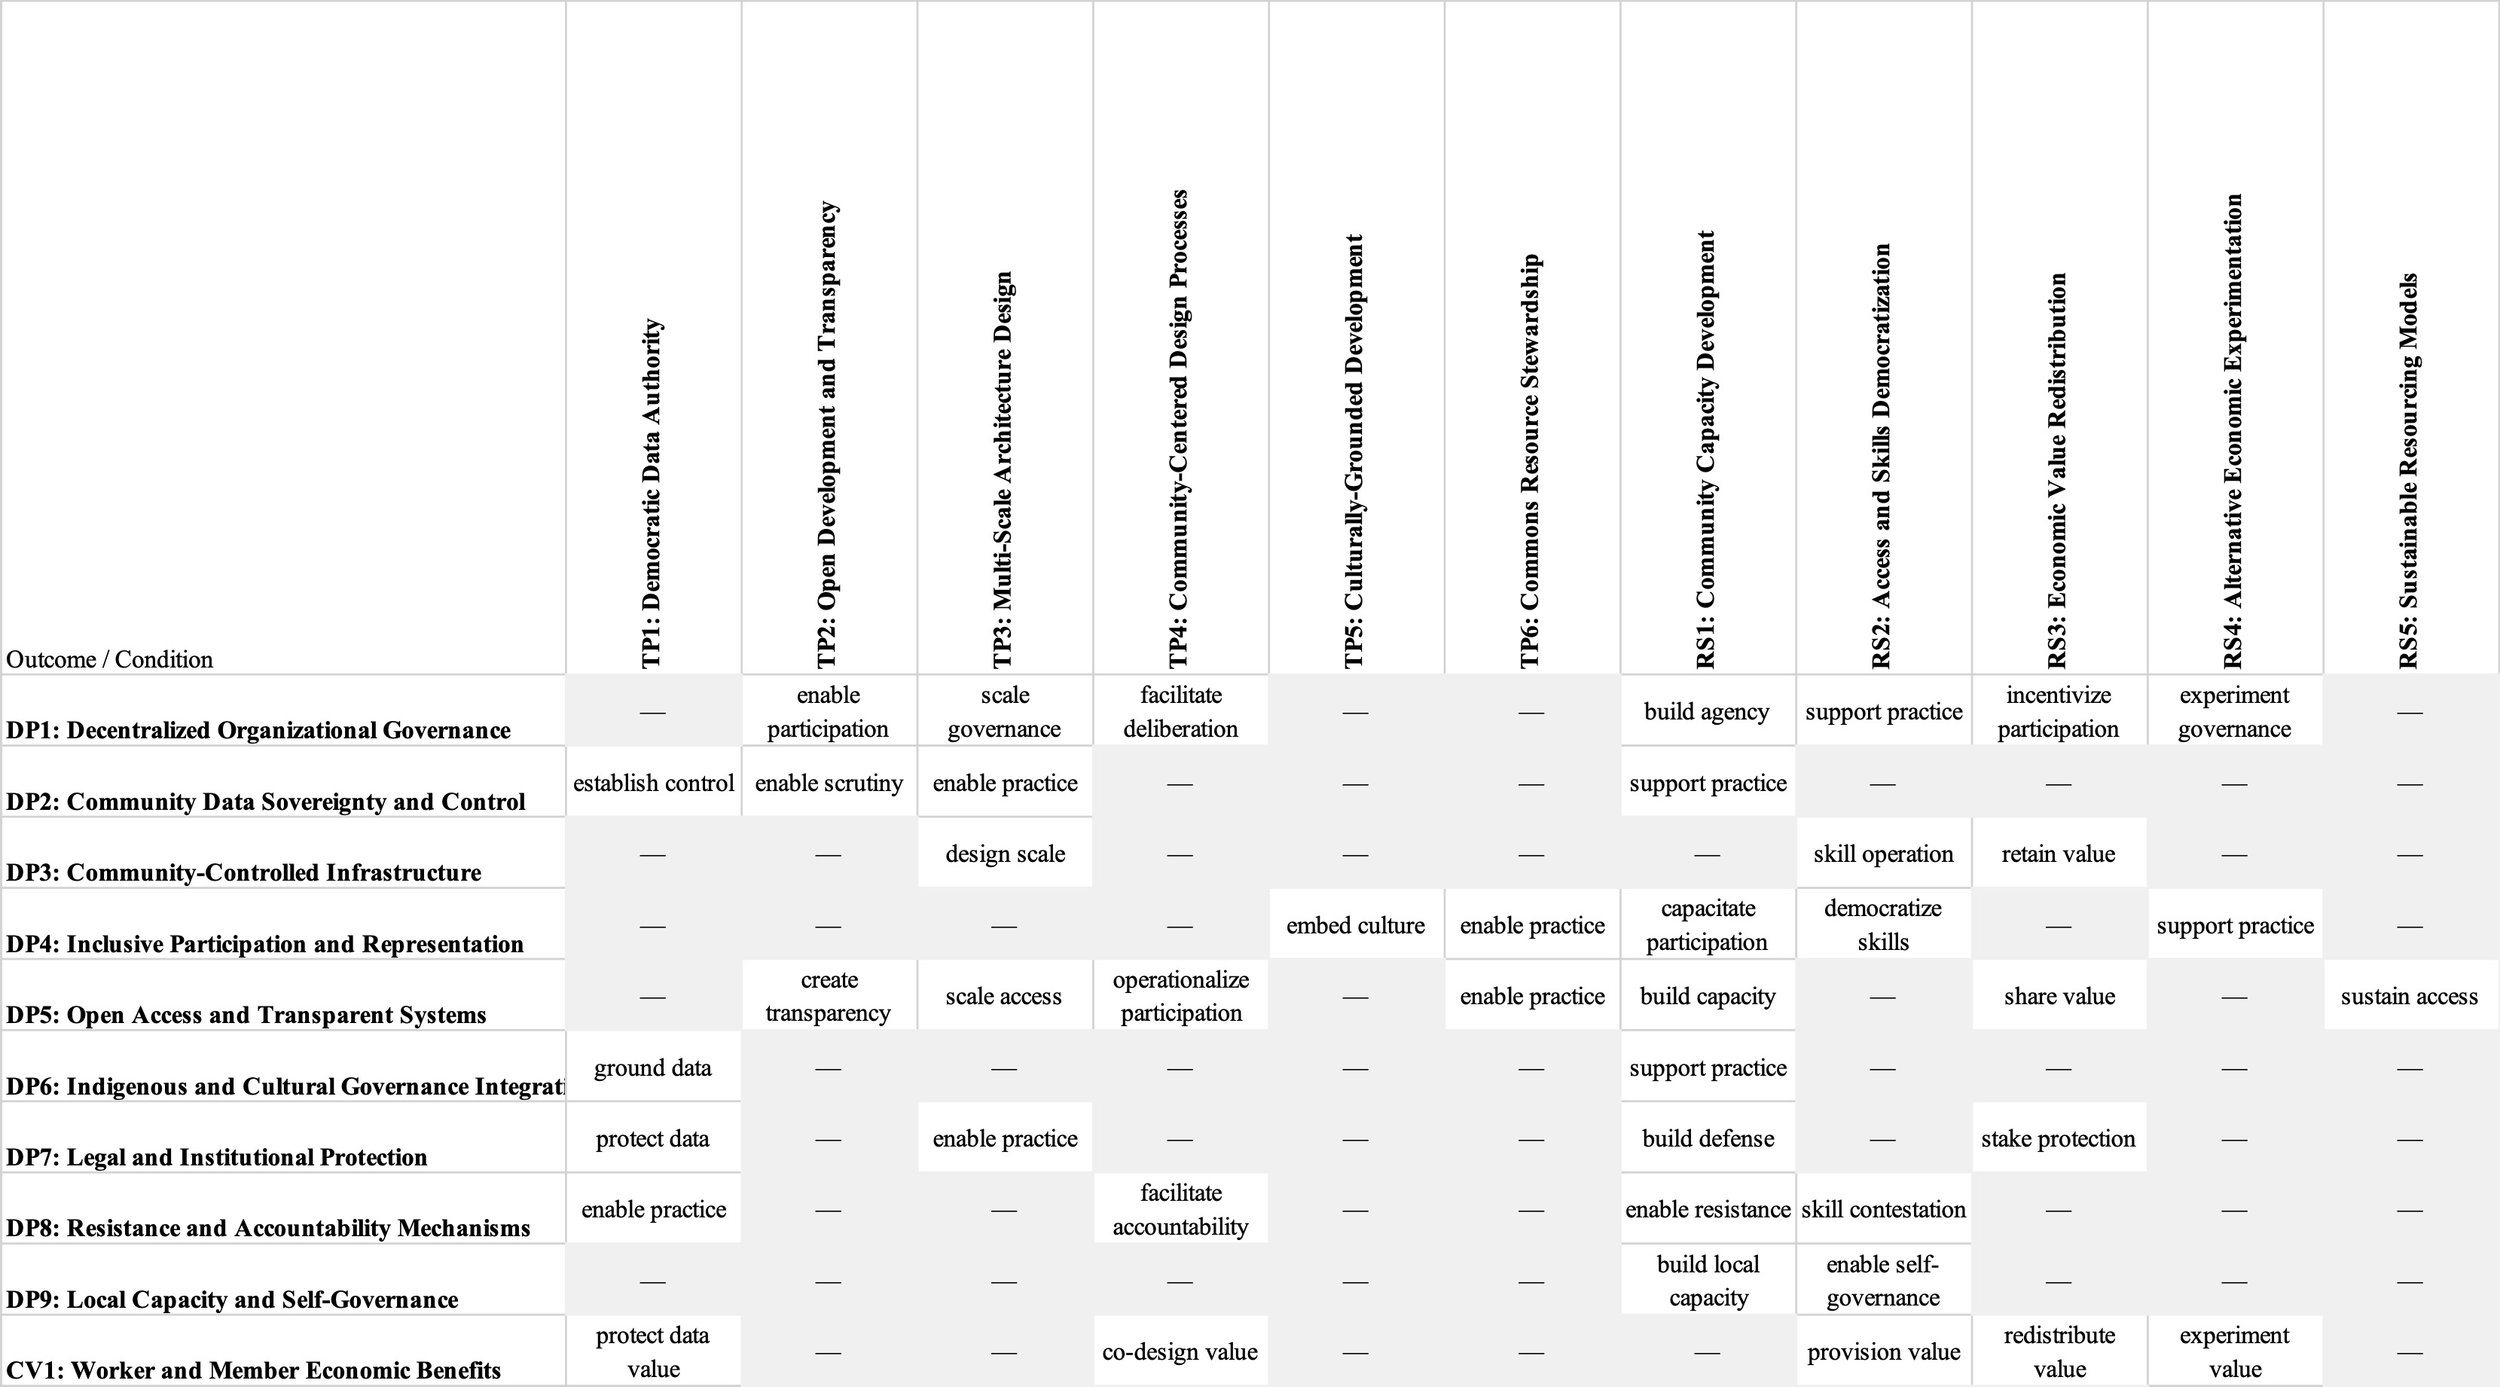
The image below is a section of the qualitative Outcomes x Conditions matrix. The link to the Excel file is here.
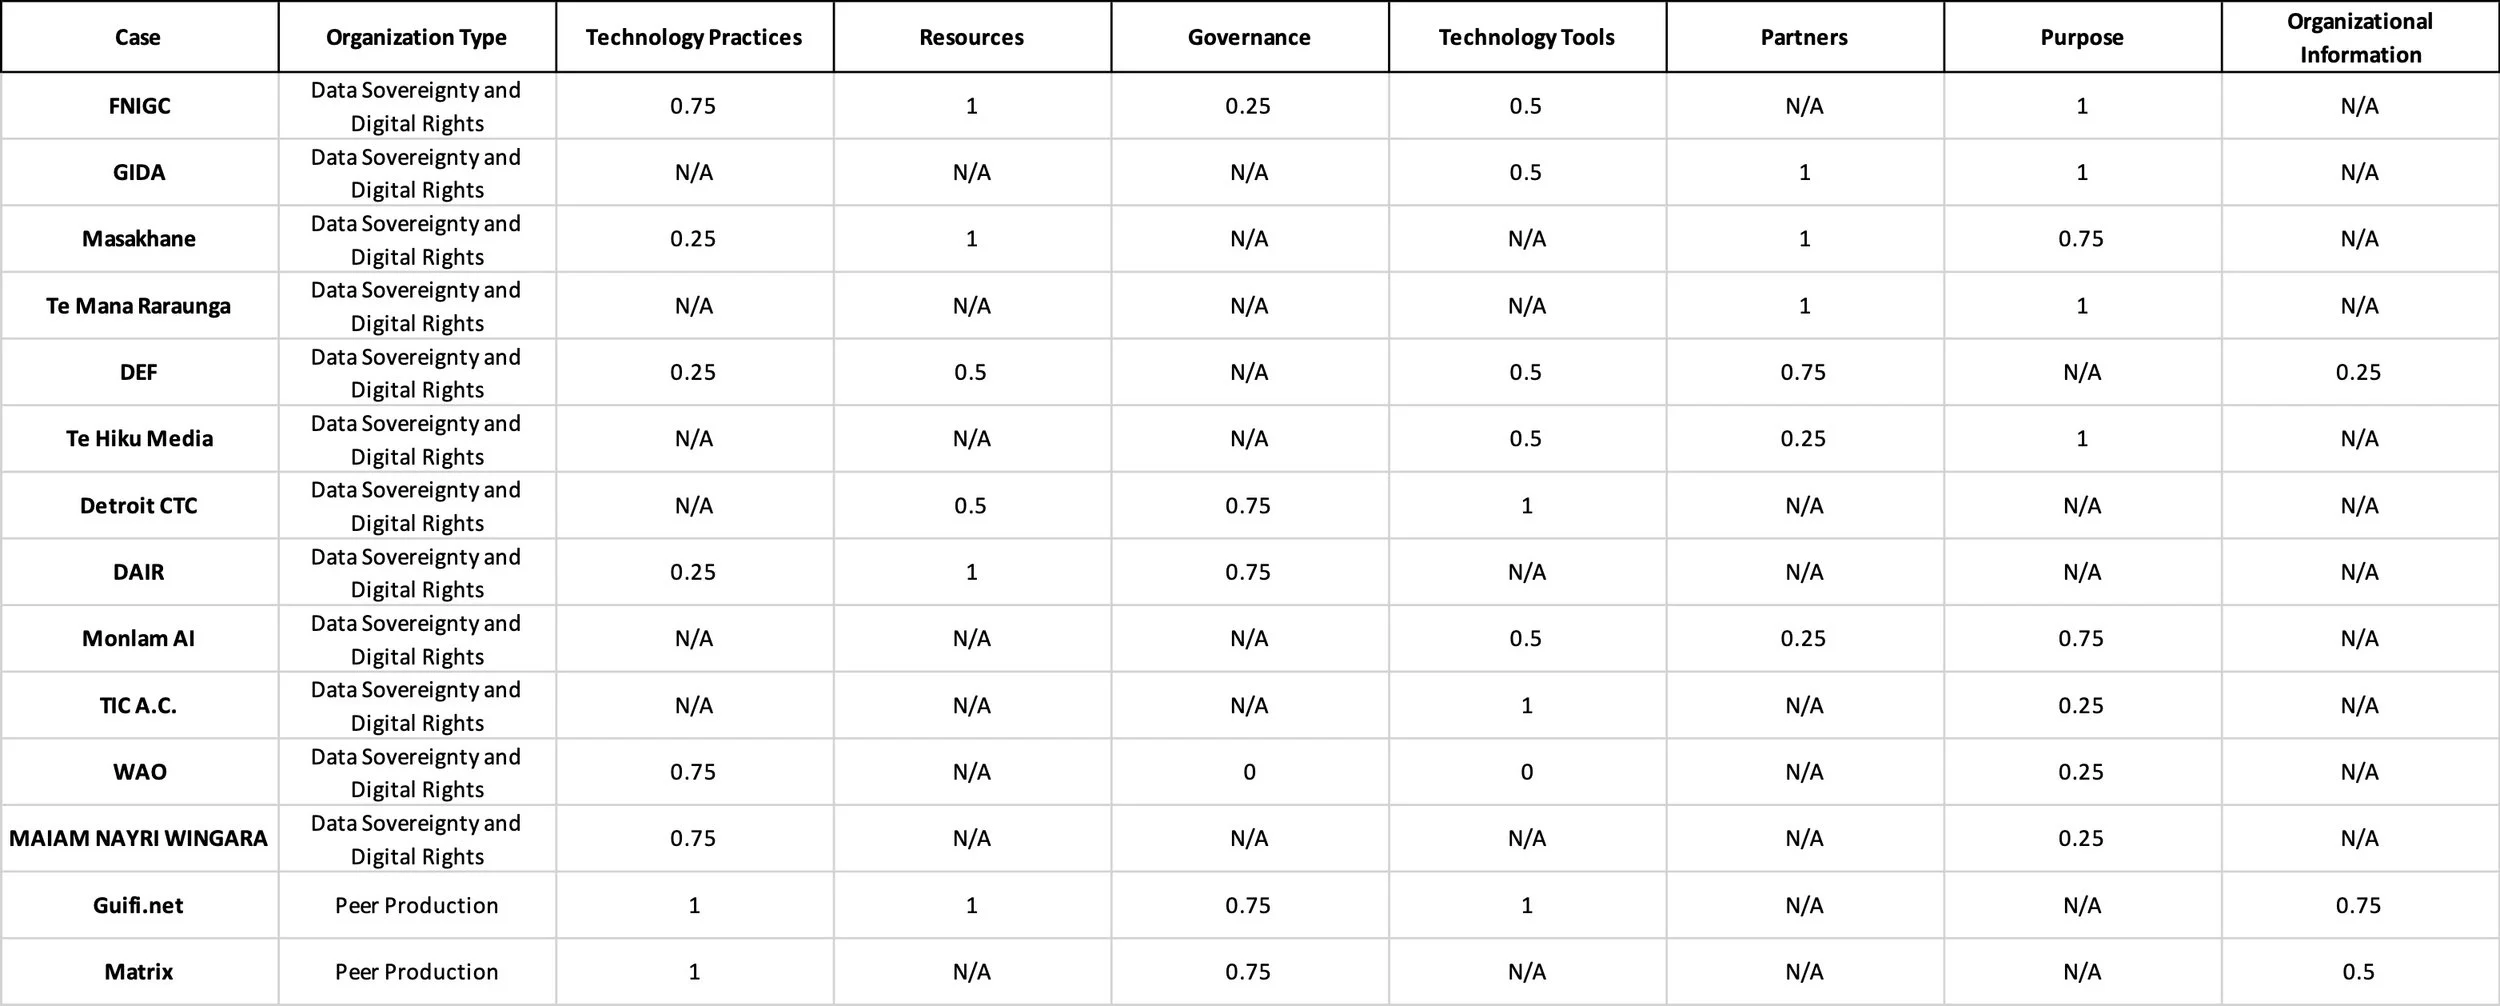
The images below are sections of the qualitative and quantitative matrices for case positioning within CONDITIONS, both of which are tables in the same Excel file. The link to that Excel file is here.
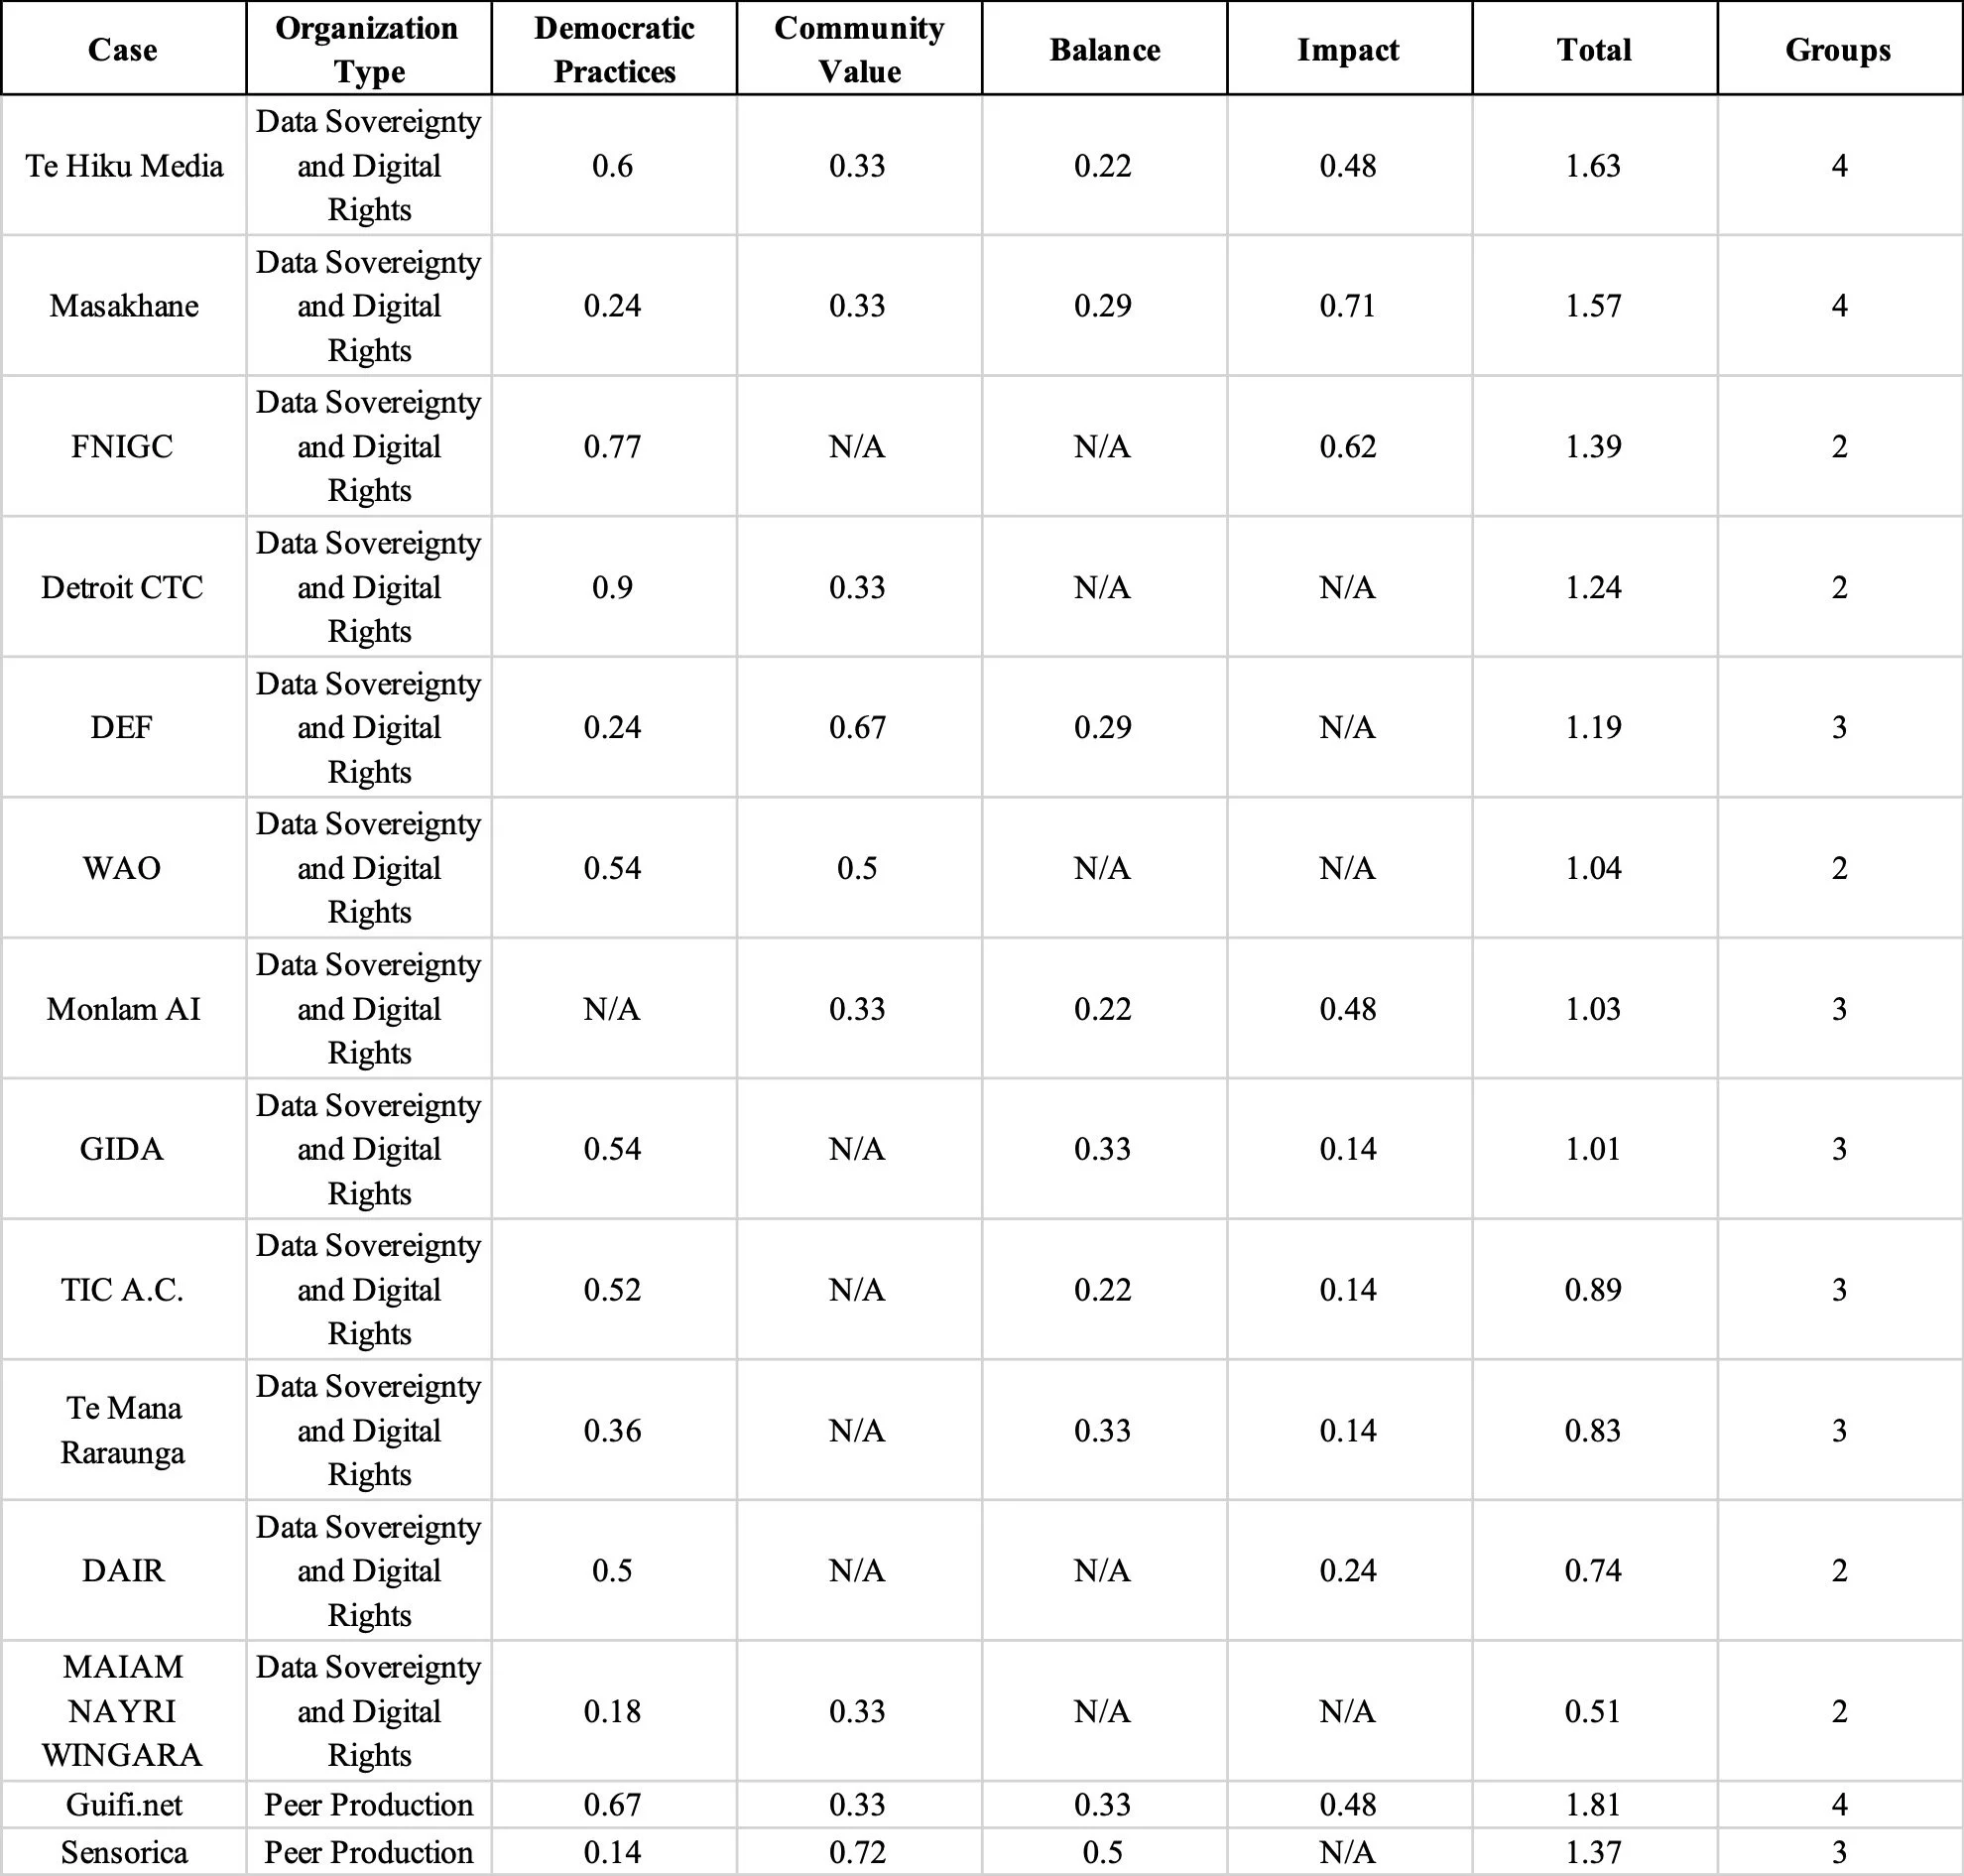
The images below are sections of the qualitative and quantitative matrices for case positioning within OUTCOMES, both of which are tables in the same Excel file. The link to that Excel file is here.